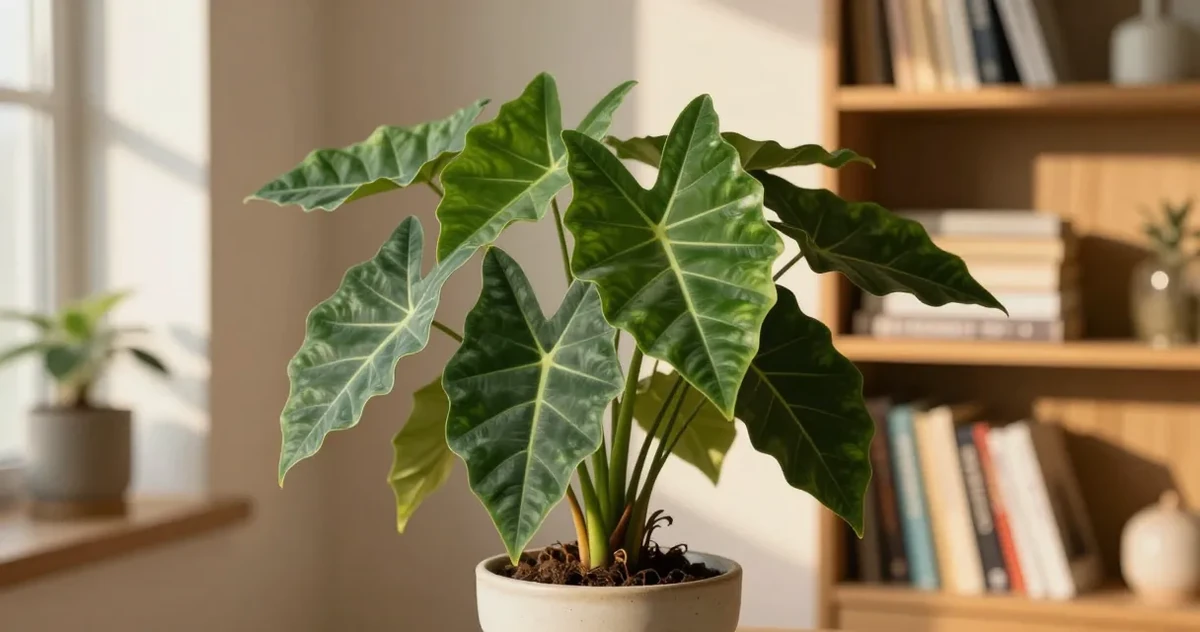
The quality-filtered native-record profile for Alocasia odora centers on 22.5°C annual mean temperature and 2890 mm annual precipitation. Its robust p10–p90 climate envelope is wider than those two medians: the coldest-month minimum spans 9.5–17.8°C, while modeled annual rainfall spans 2252–3876 mm.
This is a computed environmental fingerprint built from 30 spatially thinned climate points attached to filtered GBIF records inside the POWO native range of eastern India to southern Japan and Borneo. It describes where retained records occur in long-term gridded climate; it is not an indoor-care prescription or a physiological tolerance test.
Alocasia odora Climate DNA at a glance
| Signal | Computed result |
|---|---|
| Annual mean temperature median | 22.5°C |
| Coldest-month minimum, p10–p90 | 9.5–17.8°C |
| Warmest-month maximum, p10–p90 | 27.5–30.2°C |
| Annual precipitation median | 2890 mm |
| Precipitation seasonality median | 38.8 CV |
| Evidence | 30 climate points; medium confidence (62/100) |
The source plant is described as a wet-tropical subshrub or shrub. That botanical context matters because the same regional rainfall, humidity, or radiation can be experienced very differently by a climber, epiphyte, geophyte, tree, or succulent. The page therefore reports the climate evidence without turning it into a universal potting or watering formula.
What stands out in the computed profile
- Temperature center: The annual-mean median is 22.5°C, with the middle 50% of sampled points between 21.3 and 23.2°C. In this model that is a warm annual baseline.
- Cold and heat edges: The robust outer envelope runs from 9.5°C at the p10 coldest-month minimum to 30.2°C at the p90 warmest-month maximum. The 20.7°C span is moderate; it is an occurrence-climate span, not a laboratory tolerance range.
- Rainfall volume: Median modeled annual precipitation is 2890 mm, while the p10–p90 range is 2252–3876 mm. The wet end is 1.7 times the dry end, evidence that one annual total would hide real geographic variation.
- Rainfall timing: The precipitation-seasonality median is 38.8 CV, placing this record set in the fairly even band used by this renderer. That describes variation through the year, not how often to water a pot.
- Atmosphere and open sky: Relative humidity centers on 64.3%, while solar radiation centers on 15.5 MJ/m²/day. Both are gridded outdoor climate values; neither reports the humidity or light at an indoor leaf.
Together, those observations describe the climate attached to retained records of Alocasia odora. They do not establish the species’ physiological limits, and they should not be converted directly into thermostat, humidifier, or watering targets.
Native-record climate envelope
| Variable | p10 | p25 | Median | p75 | p90 |
|---|---|---|---|---|---|
| Annual mean temperature | 19.8°C | 21.3°C | 22.5°C | 23.2°C | 23.9°C |
| Coldest-month minimum | 9.5°C | 11.1°C | 12.5°C | 15.0°C | 17.8°C |
| Warmest-month maximum | 27.5°C | 27.8°C | 28.6°C | 30.0°C | 30.2°C |
| Annual precipitation | 2252 mm | 2501 mm | 2890 mm | 3630 mm | 3876 mm |
| Precipitation seasonality | 25.2 CV | 30.6 CV | 38.8 CV | 76.1 CV | 88.9 CV |
| Relative humidity | 61.7% | 63.3% | 64.3% | 65.4% | 66.5% |
| Solar radiation | 14.3 MJ/m²/day | 14.7 MJ/m²/day | 15.5 MJ/m²/day | 16.3 MJ/m²/day | 17.1 MJ/m²/day |
The outer p10–p90 values are a robust descriptive envelope; the middle p25–p75 band shows where the central half of sampled climate values falls. Neither band is an “ideal range.” Occurrence density, collection effort, native-range boundaries, coordinate quality, and CHELSA grid resolution all shape what appears here.
Native occurrence records
The CHELSA climate-extraction sample covers 26 quarter-degree grid cells across the native-country filter (BD, BN, CN, ID, IN, JP, KH, LA, MM, MY, TH, TW, VN). Its coordinate bounds run from 22.009° to 35.141° latitude and 114.208° to 139.153° longitude. Bounds show sampled coverage, not the legal or botanical outline of the species’ range.
| Filtering stage | Records |
|---|---|
| GBIF records returned before filters | 10077 |
| Accepted before spatial thinning | 1466 |
| Usable coordinates after spatial thinning | 440 |
| CHELSA climate-extraction points | 30 |
Recorded rejection counts were basis of record: 121, coordinate uncertainty: 42, license: 8448. The pipeline also constrains records to the POWO native-country list, removes duplicate spatial cells, and retains the source timestamp and record-set hash. A low count can be scientifically honest: it is better to expose weak coverage than to fill the gap with invented precision.
How this profile compares inside its 10-plant cluster
Within this release cluster, Alocasia odora ranks #6 of 10 for median coldest-month temperature, #3 for annual-mean temperature, #1 for annual precipitation, #9 for precipitation seasonality, and #5 for usable climate-point sample size. Ranks compare only the ten selected profiles and are descriptive, not measures of plant quality or indoor difficulty.
The closest profiles in the same normalized seven-variable comparison are:
- Taro Elephant Ear Climate DNA — normalized climate distance 0.861
- Prayer Plant Climate DNA — normalized climate distance 0.924
- Blushing Philodendron Climate DNA — normalized climate distance 0.963
The cluster was selected deterministically: the remaining ten profiles after the current 20-plant dataset is split at the median coldest-month temperature. This keeps the collection rule reproducible and prevents an editorial label from overriding the data.
What this can—and cannot—change about care
Native-record climate can improve the questions you ask. For Alocasia odora, the very wet rainfall median and fairly even precipitation signal indicate that annual rain volume alone is incomplete. Indoors, substrate structure, pot volume, root density, airflow, temperature, and actual light determine drying. Never convert millimeters of regional rainfall into a weekly watering interval.
The same limit applies to temperature, humidity, and solar radiation. CHELSA describes outdoor long-term grid cells; glass, walls, heating, air conditioning, shade, and distance from a window create a different microclimate. Use this profile to understand the source evidence and to frame observations, then use the Alocasia odora care guide for practical indoor-care context.
Confidence and limits
Confidence is medium (62/100). The score reflects sample size, spatial coverage, and coordinate-precision reporting in this pipeline version. It is not a probability that the numbers are “correct,” and it does not measure how well a particular plant will perform in a particular home.
Important limits remain: GBIF is a record of observations and specimens, not a balanced field survey; a native-country filter is coarser than a verified native-range polygon; historical and cultivated records can be difficult to classify; CHELSA values are modeled long-term normals rather than sensor readings at each plant. The page reports ranges and provenance so those constraints remain visible.
Methodology and sources
- Resolve the accepted taxon through the GBIF Species API and retain the taxon key 9506227.
- Constrain the occurrence query using the POWO native distribution: Eastern India to southern Japan and Borneo.
- Filter GBIF occurrence records for usable coordinates, uncertainty, basis of record, establishment signals, duplicate locations, native countries, and compatible CC0/CC-BY licensing.
- Spatially thin accepted records at 0.05° before climate extraction so dense collecting areas do not dominate the distributions.
- Sample CHELSA-climatologies V2.1 1981-2010 grids using
stable hash sample, maximum 30 post-filter and spatially thinned GBIF recordsand calculate p10, p25, median, p75, and p90 deterministically. - Persist source URLs, timestamps, rejection counts, record hash
235765c2b77f1ec478dba5e6d6c9fa4dbe92d451bdd48f7120a196a876663c41, and fact hashcdada45b84759b0b207e348e10f47acddf0c44a504c4f739e3ad350c49265050.
Source licenses recorded by the pipeline: occurrences, CC-BY-4.0, CC0-1.0 on retained records; CHELSA climate layers, CC0-1.0. Derived summaries and comparisons are transformations of the cited source data.
Continue from the data
-
Taro Elephant Ear Climate DNA — normalized climate distance 0.861
-
Prayer Plant Climate DNA — normalized climate distance 0.924
-
Blushing Philodendron Climate DNA — normalized climate distance 0.963
Bring the evidence back to your actual plant
Use KnowYourPlant to identify the species, record changes, and compare this broad climate context with conditions in your home.
Open KnowYourPlant