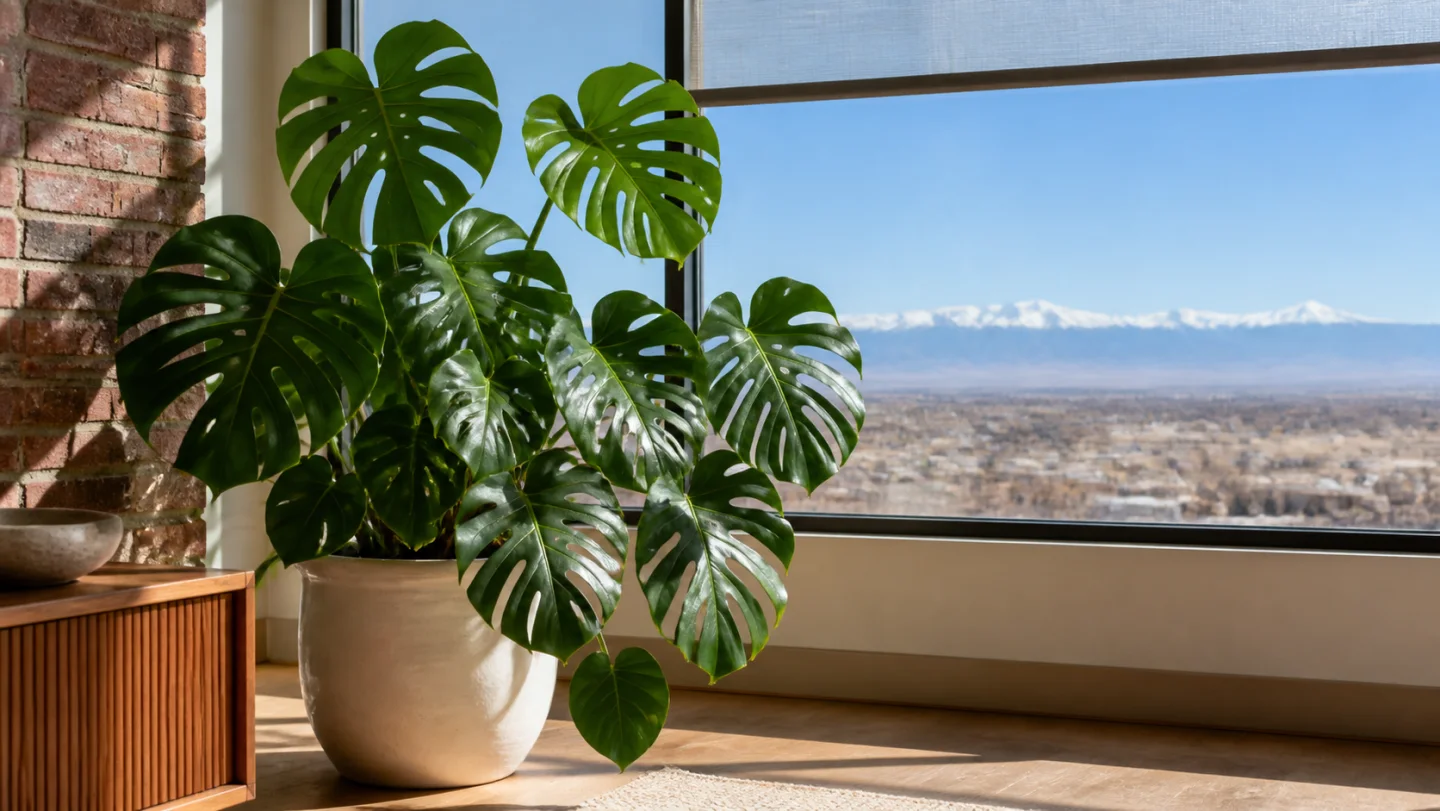
Denver has an indoor-first climate for Monstera deliciosa, with an outdoor climate-match score of 40/100. The score does not say whether a plant can live in your home. It compares the city’s outdoor normals with the climate envelope measured at quality-filtered records in the species’ native range, then separates that outdoor comparison from the care pressure on a potted indoor plant.
The useful answer is seasonal: the strongest fully suitable outdoor window is no month in the 30-year normal. A broader, marginal window is no reliable outdoor window, but marginal months need day-by-day judgment and a protected, shaded position. Indoors, use the monthly calendar below to decide when to check the pot sooner or later. It is deliberately not a fixed watering schedule.
The direct climate answer for Denver
Cold is the largest mismatch in Denver. The practical consequence is a firm indoor season: a warm afternoon does not cancel repeated cold-night exposure, especially beside cold glass or on an exposed balcony. The city’s low-temperature signal reaches -15.5°C in the coldest part of the normal year, while the hot-temperature signal reaches 34.8°C. Those are outdoor climate values, not indoor room measurements.
The local pattern is not a generic season swap. In the 1991–2020 NASA POWER normal, July is the wettest month and January is the driest, while outdoor solar input peaks in June and bottoms out in December. For an indoor Monstera in Denver, those signals matter because pot drying can change even when your room temperature changes only a little.
The overall score is rounded to the nearest five. That is intentional: reanalysis grids, occurrence locations, a city’s microclimates, and the difference between outdoor weather and an actual room do not justify single-point precision.
Outdoor climate match: 40/100
0/100 — Cold-Night Compatibility. Denver is the clearest macroclimate constraint.
55/100 — Warm-Season Heat Compatibility. Denver departs materially from the habitat envelope.
85/100 — Outdoor Solar-Climate Compatibility. Denver sits mostly inside the occurrence-derived habitat envelope.
45/100 — Precipitation And Humidity Compatibility. Denver departs materially from the habitat envelope.
45/100 — Seasonal-Rhythm Compatibility. Denver departs materially from the habitat envelope.
The weighted score uses cold 30%, heat 20%, moisture 20%, light 20%, and seasonality 10%. Cold receives the largest weight because Monstera deliciosa is frost-sensitive and a single cold exposure can matter more than a modest mismatch in annual averages. “Light” here means outdoor solar climate, not the light at a particular windowsill.
Native climate versus Denver
The plant Climate DNA was built from 154 spatially thinned GBIF occurrence records within the POWO native range of southern Mexico to Guatemala. CHELSA 1981–2010 values were sampled at those coordinates, then summarized with robust percentiles so a small number of extreme records could not define the whole envelope. The city side uses the NASA POWER custom 1991–2020 climatology for a consistent long-term monthly comparison.
| Signal | Native occurrence envelope (p10–p90) | Denver normal |
|---|---|---|
| Coldest-month minimum | 8.2 to 18.6°C | -15.5°C low-temperature signal |
| Warmest-month maximum | 23.1 to 32.8°C | 34.8°C hot-temperature signal |
| Annual precipitation | 912 to 3408 mm | 457 mm |
| Relative humidity | 57 to 69% | 50% |
| Outdoor solar climate | 16.9 to 20.8 MJ/m²/day | 17.4 MJ/m²/day |
These comparisons describe macroclimate. Monstera is a forest climber, so an open-sky solar value cannot be read as the amount of light its leaves receive below a canopy—or behind your glass.
Month-by-month Monstera care calendar
| Month | Mean temp | Colder-night signal | Humidity | VPD | Pot-check pressure | Outdoors | What to do |
|---|---|---|---|---|---|---|---|
| January | -1.8°C | -15.5°C | 56% | 0.24 kPa | low | indoors | Keep the plant indoors and away from cold glass or drafts; let the pot dry further before rechecking. |
| February | -0.9°C | -14.6°C | 55% | 0.26 kPa | low | indoors | Keep the plant indoors and away from cold glass or drafts; let the pot dry further before rechecking. |
| March | 3.0°C | -11.0°C | 52% | 0.36 kPa | low | indoors | Keep the plant indoors and away from cold glass or drafts; let the pot dry further before rechecking. |
| April | 6.7°C | -8.0°C | 51% | 0.48 kPa | low | indoors | Keep the plant indoors and away from cold glass or drafts; let the pot dry further before rechecking. |
| May | 12.6°C | -3.2°C | 49% | 0.74 kPa | moderate | indoors | Keep the plant indoors and away from cold glass or drafts; let the pot dry further before rechecking. |
| June | 19.0°C | 4.2°C | 42% | 1.27 kPa | high | indoors | Keep the plant indoors and away from cold glass or drafts; let the pot dry further before rechecking. |
| July | 21.9°C | 9.8°C | 45% | 1.45 kPa | high | indoors | Keep the plant indoors and away from cold glass or drafts; let the pot dry further before rechecking. |
| August | 20.5°C | 8.5°C | 47% | 1.27 kPa | high | indoors | Keep the plant indoors and away from cold glass or drafts; let the pot dry further before rechecking. |
| September | 16.0°C | 0.7°C | 45% | 1.00 kPa | moderate | indoors | Keep the plant indoors and away from cold glass or drafts; let the pot dry further before rechecking. |
| October | 8.7°C | -7.0°C | 48% | 0.58 kPa | low | indoors | Keep the plant indoors and away from cold glass or drafts; let the pot dry further before rechecking. |
| November | 2.3°C | -11.6°C | 52% | 0.34 kPa | low | indoors | Keep the plant indoors and away from cold glass or drafts; let the pot dry further before rechecking. |
| December | -2.0°C | -15.4°C | 56% | 0.23 kPa | low | indoors | Keep the plant indoors and away from cold glass or drafts; let the pot dry further before rechecking. |
The low-temperature column uses NASA POWER’s monthly minimum-average climatology, not a forecast and not a room reading. The drying column is vapor-pressure deficit calculated from the monthly temperature and relative humidity. It compares atmospheric drying pressure between months but does not measure water leaving your specific pot.
How to use the watering-pressure signal
The pressure scale is relative within Denver. A high-pressure month means the local mix of temperature, humidity, and atmospheric drying suggests checking the substrate earlier than in a low-pressure month. It never means “water now.” Pot diameter, root density, substrate, indoor heating or air conditioning, and distance from the window can easily outweigh the outdoor monthly signal.
Use the same observation loop all year: feel or probe the root zone, note the pot’s weight, look for active growth, and compare how long drying took after the previous watering. If the mix is still moist, wait. If it is dry at the depth appropriate for the pot and the plant is actively using water, water thoroughly and let the excess drain.
The 12-month climate dossier for Denver
This section expands the table into month-to-month changes. Each comparison uses only the stored 1991–2020 city normal and the occurrence-derived plant envelope; it does not infer the conditions inside a particular room.
January in Denver: severe cold risk, low check pressure
Denver’s January profile pairs a -1.8°C mean with 56% humidity and 17 mm of modeled precipitation. From December to January, the mean changes +0.2°C, solar input changes +1.0 MJ/m²/day, and VPD changes +0.0 kPa. Its -15.5°C low-temperature signal falls below the native-record p10 of 8.2°C. Action: Keep the plant indoors and away from cold glass or drafts; let the pot dry further before rechecking.
February in Denver: severe cold risk, low check pressure
For February in Denver, the climate normal reads -0.9°C, 55% relative humidity, and 12.9 MJ/m²/day of solar input. From January to February, the mean changes +0.9°C, solar input changes +3.6 MJ/m²/day, and VPD changes +0.0 kPa. Its -14.6°C low-temperature signal falls below the native-record p10 of 8.2°C. Action: Keep the plant indoors and away from cold glass or drafts; let the pot dry further before rechecking.
March in Denver: severe cold risk, low check pressure
The Denver signal for March is defined by -11.0°C on the low side, 20.2°C on the high side, and 0.36 kPa VPD. From February to March, the mean changes +3.9°C, solar input changes +4.1 MJ/m²/day, and VPD changes +0.1 kPa. Its -11.0°C low-temperature signal falls below the native-record p10 of 8.2°C. Action: Keep the plant indoors and away from cold glass or drafts; let the pot dry further before rechecking.
April in Denver: severe cold risk, low check pressure
In Denver, April brings 55 mm modeled precipitation, a 51% humidity normal, and low pot-check pressure. From March to April, the mean changes +3.7°C, solar input changes +3.7 MJ/m²/day, and VPD changes +0.1 kPa. Its -8.0°C low-temperature signal falls below the native-record p10 of 8.2°C. Action: Keep the plant indoors and away from cold glass or drafts; let the pot dry further before rechecking.
May in Denver: severe cold risk, moderate check pressure
May places Denver at 12.6°C mean temperature with a slow growth signal and indoors outdoor status. From April to May, the mean changes +5.9°C, solar input changes +2.6 MJ/m²/day, and VPD changes +0.3 kPa. Its -3.2°C low-temperature signal falls below the native-record p10 of 8.2°C. Action: Keep the plant indoors and away from cold glass or drafts; let the pot dry further before rechecking.
June in Denver: severe cold risk, high check pressure
The practical June reading for Denver: 25.7 MJ/m²/day outdoors, 1.27 kPa VPD, and high relative check pressure. From May to June, the mean changes +6.4°C, solar input changes +2.4 MJ/m²/day, and VPD changes +0.5 kPa. Its 4.2°C low-temperature signal falls below the native-record p10 of 8.2°C. Action: Keep the plant indoors and away from cold glass or drafts; let the pot dry further before rechecking.
July in Denver: high cold risk, high check pressure
Denver’s midyear July normal spans a 9.8°C low signal to a 34.8°C high signal, with 45% humidity. From June to July, the mean changes +2.9°C, solar input changes -0.6 MJ/m²/day, and VPD changes +0.2 kPa. Its 34.8°C heat signal exceeds the native-record p90 of 32.8°C. Action: Keep the plant indoors and away from cold glass or drafts; let the pot dry further before rechecking.
August in Denver: high cold risk, high check pressure
By August, Denver records 20.5°C mean temperature, 58 mm modeled precipitation, and a active macroclimate growth band. From July to August, the mean changes -1.4°C, solar input changes -2.6 MJ/m²/day, and VPD changes -0.2 kPa. Its 33.1°C heat signal exceeds the native-record p90 of 32.8°C. Action: Keep the plant indoors and away from cold glass or drafts; let the pot dry further before rechecking.
September in Denver: severe cold risk, moderate check pressure
The late-season September combination in Denver is 45% humidity, 1.00 kPa VPD, and 19.2 MJ/m²/day solar input. From August to September, the mean changes -4.5°C, solar input changes -3.3 MJ/m²/day, and VPD changes -0.3 kPa. Its 0.7°C low-temperature signal falls below the native-record p10 of 8.2°C. Action: Keep the plant indoors and away from cold glass or drafts; let the pot dry further before rechecking.
October in Denver: severe cold risk, low check pressure
For a Denver Monstera, October is classified indoors outdoors and low for relative pot-check pressure; the mean is 8.7°C. From September to October, the mean changes -7.3°C, solar input changes -4.9 MJ/m²/day, and VPD changes -0.4 kPa. Its -7.0°C low-temperature signal falls below the native-record p10 of 8.2°C. Action: Keep the plant indoors and away from cold glass or drafts; let the pot dry further before rechecking.
November in Denver: severe cold risk, low check pressure
November shifts Denver to a dormant-like growth signal, backed by 2.3°C mean temperature and 52% humidity. From October to November, the mean changes -6.4°C, solar input changes -4.1 MJ/m²/day, and VPD changes -0.2 kPa. Its -11.6°C low-temperature signal falls below the native-record p10 of 8.2°C. Action: Keep the plant indoors and away from cold glass or drafts; let the pot dry further before rechecking.
December in Denver: severe cold risk, low check pressure
Closing the climate year, December in Denver shows -15.4°C on the low side, 0.23 kPa VPD, and low check pressure. From November to December, the mean changes -4.3°C, solar input changes -1.9 MJ/m²/day, and VPD changes -0.1 kPa. Its -15.4°C low-temperature signal falls below the native-record p10 of 8.2°C. Action: Keep the plant indoors and away from cold glass or drafts; let the pot dry further before rechecking.
How Denver differs from the other 10 cities
Within this 11-city cluster, Denver ranks #5 for overall outdoor match, #2 for cold severity, #4 for heat, #10 for annual precipitation, #11 for humidity, and #3 for solar input. These are descriptive ranks within this selected cluster, not claims about every city.
The nearest climate profile in the cluster is Austin, with a normalized distance of 0.849; the most contrasting profile is Singapore at 1.700. The largest mean-temperature difference from Austin appears in April (-13.2°C), while the largest VPD difference occurs in August (-0.4 kPa).
| Month | Mean temp vs Austin | Humidity vs peer | Solar vs peer | VPD vs peer |
|---|---|---|---|---|
| January | -11.1°C | -17.0% | -1.5 MJ/m²/day | -0.1 kPa |
| February | -12.6°C | -18.0% | +0.2 MJ/m²/day | -0.1 kPa |
| March | -12.7°C | -21.0% | +0.8 MJ/m²/day | -0.1 kPa |
| April | -13.2°C | -19.0% | +1.0 MJ/m²/day | -0.2 kPa |
| May | -11.7°C | -22.0% | +2.4 MJ/m²/day | -0.1 kPa |
| June | -8.9°C | -26.0% | +1.8 MJ/m²/day | +0.1 kPa |
| July | -7.7°C | -18.0% | +0.6 MJ/m²/day | -0.1 kPa |
| August | -9.4°C | -13.0% | -0.3 MJ/m²/day | -0.4 kPa |
| September | -10.3°C | -20.0% | +0.3 MJ/m²/day | -0.2 kPa |
| October | -12.2°C | -20.0% | -1.1 MJ/m²/day | -0.2 kPa |
| November | -12.4°C | -20.0% | -1.3 MJ/m²/day | -0.1 kPa |
| December | -12.2°C | -17.0% | -1.3 MJ/m²/day | -0.1 kPa |
This nearest-neighbor table is useful when advice from another city looks tempting: it shows exactly which months and climate signals transfer reasonably and which do not.
The biggest mismatch and the first three adjustments
Cold is the largest mismatch in Denver. The practical consequence is a firm indoor season: a warm afternoon does not cancel repeated cold-night exposure, especially beside cold glass or on an exposed balcony. That mismatch is why the page keeps outdoor suitability separate from local care pressure: a poor outdoor cold match can coexist with a perfectly manageable indoor plant.
- Cold protection: Treat cold nights as the hard stop: move the plant in before the first marginal month, not after visible damage.
- Drying control: Track how long the pot takes to dry. Local air and ET pressure change the check interval more reliably than a weekly schedule.
- Seasonal reset: Change the care rhythm when the growth band changes; do not carry a summer routine unchanged into the slow season.
If you are moving a plant outside, acclimate it gradually in bright shade. Reverse the move before the first marginal cold month. A forecast always outranks a climate normal for a decision on a particular day.
Confidence and limits
The plant Climate DNA confidence is high (93/100). It reflects sample size, geographic coverage across 102 quarter-degree cells, and coordinate-precision reporting. The city side uses one consistent NASA POWER source and period for every page in this cluster, which improves comparison but cannot resolve neighborhood, elevation, coastal, building, or room-level differences.
This model does not claim a physiological survival threshold. GBIF occurrence locations show where records exist; CHELSA and NASA POWER describe modeled macroclimate; neither dataset observes your plant, pot, or window. Use the result as a prioritization aid and combine it with current forecasts and direct observation.
Methodology and sources
- Taxonomy: GBIF Species API record; accepted name Monstera deliciosa.
- Native distribution: Plants of the World Online; Southern Mexico to Guatemala.
- Occurrences: GBIF occurrence search; bad coordinates, uncertainty over 10 km, non-native countries, cultivated/introduced status, duplicates, and licenses other than CC0/CC-BY were excluded.
- Plant climate: CHELSA-climatologies V2.1, 1981–2010, CC0-1.0.
- City climate: NASA POWER Climatology API, custom 1991–2020 climatology, service v2.9.7. NASA POWER referencing guide.
Continue your Monstera plan
Start with the Monstera Climate DNA profile to see the occurrence-derived native climate envelope, continue with the complete Monstera deliciosa indoor care guide, browse the Monstera climate guides by city, then compare another city climate:
- Monstera care in New York City
- Monstera care in Los Angeles
- Monstera care in San Francisco
- Monstera care in Seattle
Turn the climate signal into observations
Use KnowYourPlant to identify your plant, log what you see, and keep care notes for the conditions in your actual home.
Open KnowYourPlant